[Further Analysis] Your favorite text editor/IDE
Be sure to check out the poll, the poll’s HN comments, the raw results, the initial analysis, and the initial analysis’s HN Comments. Big thanks to Utkarsh for putting this together, making the results public, and expressing interest in the opinions of others regarding the data.
These were some of the metrics I wanted to see. You’ll notice that all of these are proportional comparisons; y is always out of 100%. This is because there was no consistency in the number of submissions per category, per user. It might be interesting to repeat something like this, but limit each user to one-one-one submissions, and then allow multiple submissions. Then we could really say things like, ‘Ruby devs like VIM’ and ‘objective-c users like xcode’. As it stands, I can say things like, ‘around 75% of activepython users did not indicate any alternative IDE usage’ and ‘fewer than 5% of devs using textpad indicate that they develop in ruby’. Not quite as meaningful, but the comparison tables are interesting (although predictable); and came with a couple of surprises.
I also think it would be good to devote some time to mining deeper to get a little bit more info about which results are coming out of multiple submissions and which stem from single data points (although there are very few submissions that have single values in multiple fields; most devs who submitted a single language, submitted multiple editors - or similar).
Some expected/unexpected (at least by me) results:
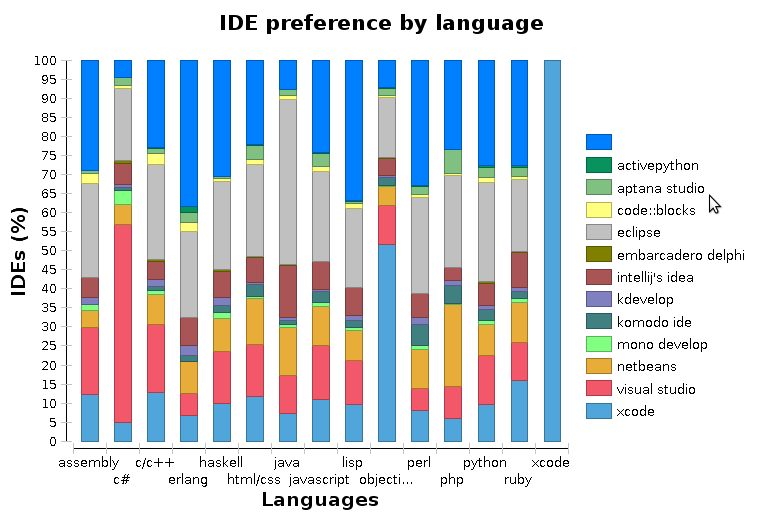
- A. (Unexpected) Objective-c devs are expressing a lot of textmate use. My surprise here is that people are using anything other than xCode to develop objective-c. I need to dig more here to confirm this, but I’m assuming this is a case where users are developing multiple languages, and using textmate for non-objective-c needs. Note: I do not do much objective-c development, so I could be way off on this one.
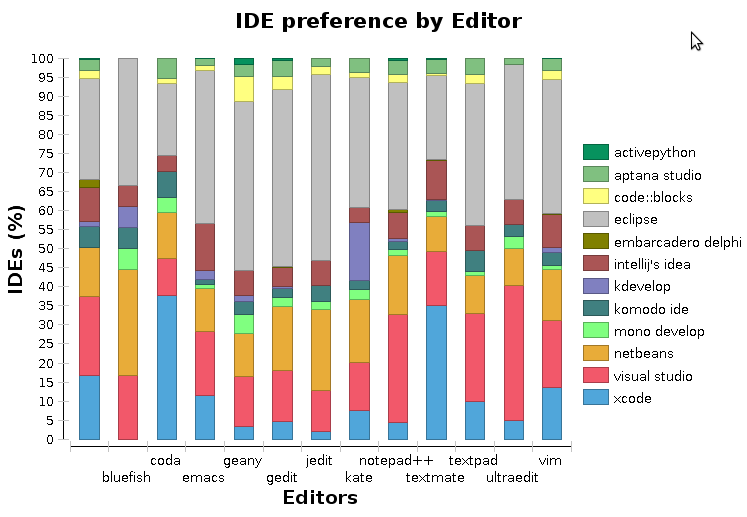
- A,D. (Expected) Lisp/Erlang devs tend to like emacs.
- B. (Expected) C# devs have a high rate of Visual Studio usage, Java devs have a high rate of Eclipse usage, and Objective-c devs have a high rate of xcode usage.
- D. (Unexpected) Ruby makes up a larger percentage of the textmate languages than I would have expected (again, this could be an issue stemming from multiple submissions per individual.
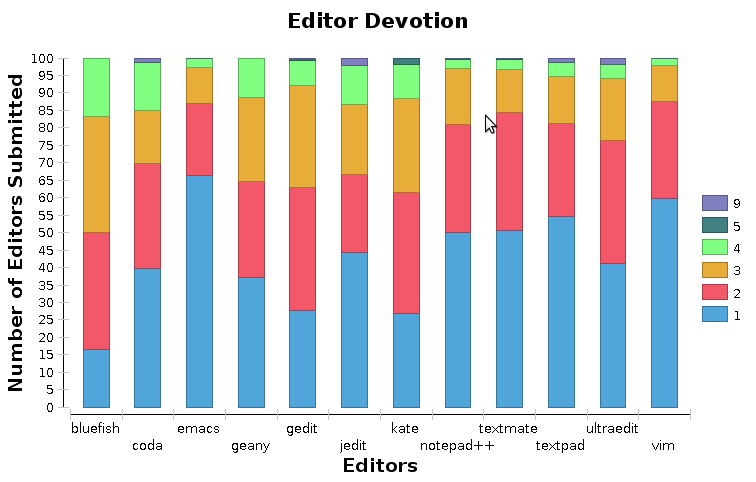
- G. (Expected) Emacs and Vim users had the highest devotion. I’m using ‘devotion’ to indicate how many checkboxes were submitted per category. If I only submitted the Vim editor, I have high devotion; if I submitted seven different editors, including Vim, I represent low devotion for Vim (and the six other editors).
- G. (Unexpected) Textpad, Textmate, and Notepad++ were third, fourth, and fifth in editor devotion (and jedit came in sixth.
- H. (Expected) HTML/CSS, JavaScript, and PHP had very low devotion. I think this stems mostly from the demographic (Hacker News) participating in the study.
- I. (Expected) IDEs generally had higher levels of devotion.
Charts!
A.

B.
C.
D.

E.

F.

G.
H.

I.

Wrap up
Make sure you check out the initial analysis for the actual values, they give the percentages a lot more context. That is, the VIM, Eclipse, JavaScript/Python numbers are likely to be more meaningful (and more accurate), since they have the higher absolute values. Let me know if you spot any errors or have questions/requests.